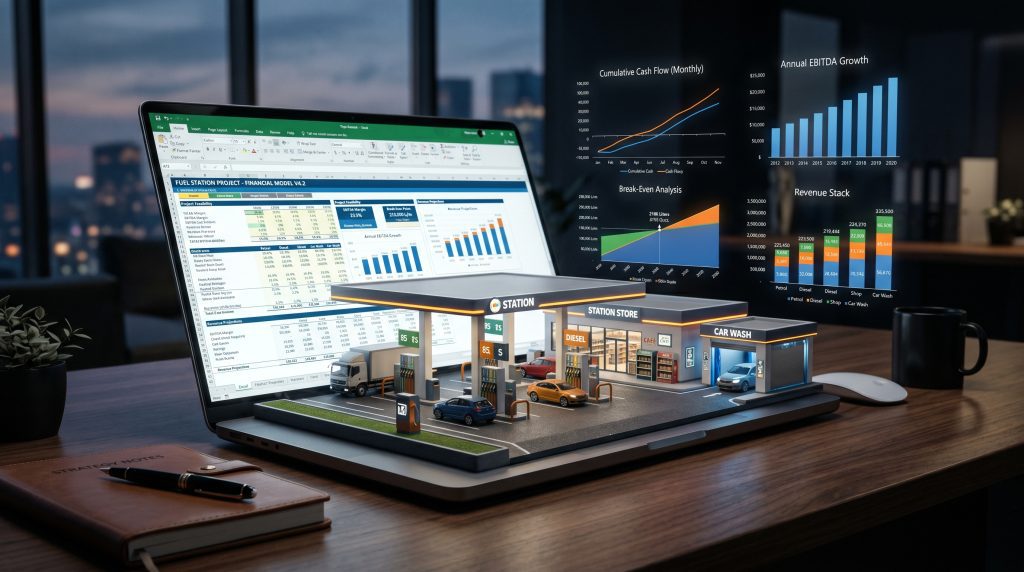
If you are developing, financing, or evaluating a fuel station, gas station, or petrol station and need a financial model that gives you real answers — what your 10-year revenue will be across three operating streams, whether the project services its debt at a lender-required DSCR, and what equity investors actually receive after distributions — this is the template built specifically for that work.
This gas station financial model Excel covers your complete 10-year financial picture across three independently modelled revenue streams: fuel sales across four grades (e.g., Regular 93, Regular 95, Premium, and Diesel), car wash operations, and a convenience store.
Every assumption you enter — pump count, daily throughput per grade, margin per litre, car wash throughput, store floor space, staffing, CAPEX, financing terms, and working capital — flows automatically through to your Income Statement, Balance Sheet, and Cash Flow Statement. You receive fully integrated three-statement financials without having to build a single formula yourself.
The fuel station financial model template includes a fully completed mock scenario — a real-world South African fuel filling station example that shows you exactly how inputs, calculations, and outputs connect across the entire model before you replace anything with your own numbers. You see the finished model working before you start, not after.
The “assumptions-driven architecture” keeps the process clean. You adjust your inputs — site details, fuel grades, throughput, pricing, car wash volumes, store turnover, CAPEX, debt structure — and every financial statement, KPI output, and investor return calculation updates automatically across the full 10-year horizon. No formula editing. No manual recalculations.
Open the Assumptions tab and work through each input category in sequence. Start with site details and currency selection, then work through CAPEX categories. Define your financing structure — equity contribution, debt amount, interest rate, loan tenure, and repayment schedule.
Move to revenue inputs: set your fuel grades with daily throughput, pump count, per-litre margin, and annual price escalation for each grade. Set your car wash inputs — daily car count, revenue per wash, and seasonal adjustments. Add your convenience store floor space and revenue per square metre. On the cost side, enter direct and indirect payroll, utilities, maintenance, insurance, lease or acquisition amortisation, and overheads.
Once inputs are complete, review the Financial Statements tab (consolidated P&L, balance sheet, cash flow) and the Key Metrics tab (EBITDA, Return on Equity, Return on Assets, Return on Invested Capital, Current Ratio, and Debt-to-Equity Ratio).
Then review the Valuation tab (WACC, DCF, NPV, Enterprise Value, Equity Value) and the Investor Waterfall tab (equity return by investor tranche). Use the Breakeven tab to confirm the minimum required fuel throughput under your cost structure before committing to a site.
In this petrol station financial model Excel, three revenue streams are individually modelled with their own driver-based revenue engines. Fuel sales are modelled at the grade level — for example, Regular 93, Regular 95, Premium, and Diesel — and each has its own independent inputs for throughput, pricing, margin, and volume escalation.
Each grade produces its own gross fuel revenue, COGS, and gross profit line, which are then consolidated into total fuel revenue using appropriate blending logic. Car wash revenue is modelled based on daily car count and revenue per wash. Convenience store revenue is driven by client usage, average in-store spending, and annual growth, benchmarked against retail sector norms.
The CAPEX model covers development cost categories and initial working capital. CAPEX feeds directly into the balance sheet, depreciation schedule, and cash flow statement — with no manual linking required.
You walk away with a lender-compliant, investor-ready Excel file that a bank, DFI, or equity partner can open and interrogate — with visible formulas, auditable logic, and no black-box calculations.
Specifically, this fuel station financial model Excel delivers:
Building a reliable fuel filling station financial model in Excel from scratch typically takes an experienced financial modeller 70–80 hours — and that assumes they already understand fuel retail economics, multi-grade throughput modelling, DSCR structuring, and investor waterfall mechanics. Most analysts do not have all four.
This template provides a professionally structured, fully auditable framework built around the revenue drivers, capital-structure mechanics, and lender requirements specific to fuel retail operations. The formula architecture is locked and tested — you will not introduce errors by building formulas from scratch. You spend your time on your project, not on spreadsheet architecture.
No gas station financial model on the market at this price point delivers all three revenue streams (fuel + car wash + store), all four fuel grades, a 10-year forecast, and an investor waterfall in a single integrated workbook.
The fuel station financial model Excel delivers a structured 10-year forecast, three independently modelled revenue streams, four fuel grades, three-statement integrated financials, IRR, NPV, DCF valuation, investor returns waterfall, and a pre-loaded South African mock scenario — all in a single, immediately downloadable Excel file. It is designed for fuel station operators, petroleum retail developers, private investors, DFI lenders, feasibility consultants, and acquisition analysts preparing submissions for any fuel retail project.
Whether you need a gas station financial model Excel for an SBA loan application, a fuel station financial model for a DFI submission in South Africa or Africa, or a petrol station financial model for an investor information memorandum, this file covers all of those use cases in one structured, auditable Excel workbook.
Before you purchase, watch the step-by-step video walkthrough. It shows you exactly how the template is structured, how your inputs flow through to IRR, DSCR, valuation, and investor waterfall outputs, and what the finished lender-ready model looks like. No surprises. You know exactly what you are buying before you download.
Know What You’re Buying — Watch Before Purchasing.
Watch the Fuel Station Financial Model Excel Template Video Walkthrough.
Fuel Station Financial Model Excel — Key Features
The use of this financial model is solely at the user’s own risk. Best Financial Models provides the template as a tool to assist users in their business planning and decision-making processes. However, the responsibility for adhering to the model’s instructions and guidelines lies entirely with the user. Best Financial Models cannot and will not be held liable for any inaccuracies, errors, or unintended outcomes resulting from the user deviating from the prescribed usage, including but not limited to the deletion, addition, or modification of rows, columns, formulas, or any other components of the model. Users are strongly advised to exercise caution when making any changes to the model to ensure its integrity and reliability are maintained.
| Business Type | Fuel Station |
|---|---|
| File Format | Microsoft Excel |
| Forecast Period | 10 Year |
This fuel station financial model Excel includes a 10-year integrated forecast across three revenue streams — fuel sales (four grades), car wash, and convenience store — with a full three-statement financial model (P&L, balance sheet, cash flow), FCFF, business return metrics (IRR, MOIC, WACC, NPV, payback period), breakeven analysis, PP&E schedule, CAPEX inputs, debt schedule, and working capital. Instant download.
This gas station financial model Excel forecasts three independent revenue streams: fuel sales across four grades (Regular 93, Regular 95, Premium, and Diesel), car wash operations, and convenience store sales. Each stream has its own driver-based assumptions — daily vehicle count, average tank fill, product mix, pricing, and margin per grade — and automatically consolidates into total revenue.
This fuel station financial model calculates unlevered business return metrics, including IRR (Internal Rate of Return), MOIC (Multiple on Invested Capital), WACC (Weighted Average Cost of Capital), NPV (Net Present Value), payback period, Free Cash Flow to Firm (FCFF), Terminal Value, and EBITDA average growth. All metrics are calculated automatically from your inputs — no manual formulas required.
This gas station financial model includes a dedicated break-even analysis that calculates BEP Sales Volume (cars per day), BEP in revenue, contribution margin, and contribution margin percentage. It models fixed costs, variable costs, and the sale price per service — showing you exactly how many cars your fuel station needs to sell per day to reach EBITDA breakeven under your specific cost structure.
This fuel station financial model Excel includes a full PP&E schedule (opening balance, CAPEX additions, depreciation, and closing balance) and a detailed Forecast Capital Expenditures tab covering buildings, building improvements, machines and equipment, furniture and fixtures, and computers and other equipment. Every CAPEX line feeds directly into the balance sheet and depreciation schedule — no manual linking required.
This petrol station financial model calculates daily vehicle throughput based on your operating assumptions — daily operating hours, total pumps, average service time, and cars per pump per day — to determine the maximum potential daily cars. A fuel station productivity rate and annual productivity growth are then applied to set your realistic throughput from Year 1 through Year 10 of the forecast.
This gas station financial model Excel captures the cost of service across all three revenue streams — direct payroll for fuel operations, car wash, and convenience store are each modelled separately. It also includes credit card fee modelling based on your percentage of revenue paid by card, consolidating all costs into Total Cost of Goods Sold alongside each stream’s individual service costs.
This fuel station financial model uses accounts receivable days, inventory days, and accounts payable days to model working capital — automatically calculating Net Working Capital (NWC) changes by year. The debt schedule tracks debt opening, interest, principal repayments, loan balance, and debt closing for each year of the 10-year forecast, and is fully integrated into the three-statement cash flow model.
This gas station financial model Excel is built for fuel station operators and petroleum retail developers planning a new or existing site, private investors evaluating IRR, MOIC, and NPV returns, feasibility analysts conducting independent studies, acquisition analysts valuing petrol station assets, and consultants preparing financial models for bank submissions, development finance applications, or investor information memoranda.
This Fuel Station Financial Model Excel template is a 10-year forecasting, feasibility, and valuation model built for fuel stations, gas stations, petrol stations, and fuel filling stations. It helps operators, petroleum retail developers, investors, lenders, DFIs, acquisition analysts and feasibility consultants assess revenue potential, funding requirements, debt serviceability, breakeven throughput and investor returns before committing capital.
The model converts fuel throughput, pump count, daily vehicle volumes, average tank fill, fuel margin per litre, car wash usage, convenience store spending, operating hours, staffing, CAPEX, working capital, debt funding, equity funding and investor distribution assumptions into automated financial statements, valuation outputs and lender-ready KPIs.
Designed for fuel station business plans, petrol station feasibility studies, bank and DFI funding applications, SBA loan applications, investor presentations, acquisition due diligence and project finance review, the template produces integrated 10-year Income Statement, Balance Sheet and Cash Flow forecasts. Users can test fuel volumes, margin sensitivity, car wash revenue, store revenue, CAPEX, loan repayment, DSCR, IRR, NPV, payback period, DCF valuation, enterprise value, equity value, and investor waterfall returns in a single transparent Excel file.
This fuel station investor model allows users to set and toggle the forecast period for terms ranging from 1 to 10 years.
This Fuel Station Financial Model Excel template is designed for fuel station operators, petroleum retail developers, gas station entrepreneurs, petrol station owners, private investors, equity partners, commercial banks, development finance institutions, SBA loan applicants, acquisition analysts, M&A advisors, feasibility consultants and business plan writers preparing fuel station forecasts, funding applications, investor submissions, feasibility studies or acquisition valuation work.
This product page includes a step-by-step video walkthrough and sample PDF preview pages so users can see exactly how the Fuel Station Financial Model Excel template is structured before purchasing.
The walkthrough shows the full Inputs → Calculations → Outputs flow, including site assumptions, fuel grades, daily vehicle throughput, fuel revenue, car wash revenue, convenience store revenue, CAPEX, working capital, debt funding, financial statements, DSCR, breakeven analysis, dashboard KPIs, DCF valuation and investor waterfall outputs.
This preview is useful for anyone who needs a lender-ready fuel station forecast, a gas station business plan model, a petrol station feasibility model, or an investor-ready fuel retail financial model without building a spreadsheet from scratch.
R1,999.00
We accept various methods of payment, including Visa, Mastercard, and EFT.
Our site is secured with SSL certification and we do not store any of your payment details.
Immediate access to your chosen financial model, compatible with Excel or Google Sheets.
Our templates are designed for global use, featuring support for all major currencies.
Need a complete Business Plan, Market Research, Feasibility Study, or Investor Deck for your fuel filling station venture? Explore the services of JTB Consulting, which has been providing bespoke business planning, bank‑ready models, and investor narratives to global clients since 2006.


We don’t spam, and you can always opt out at any time.