

Most business owners know they need to make money. Far fewer know the exact number at which they stop losing money. Use a break-even point calculator to find that number- one calculation that cuts through the noise and tells you the minimum revenue your business must generate before profit begins. Get it right, and it changes how you price your product, set your sales targets, hire your first employee, and present your financials to a lender.
This guide explains the break-even formula in plain terms, walks you through building a working break-even point calculator in Excel step by step, and applies the method to three real business scenarios: a product company, a service business, and a SaaS subscription model. By the end, you’ll know exactly how many units to sell, or how much revenue to generate, before your business crosses into profitable territory.
One note before we start: for founders who need break-even woven into a complete set of financial projections for lenders or investors, Best Financial Models (BFM) offers Excel templates with break-even built directly into integrated three-statement financial models. Understanding the mechanics first ensures the numbers you enter actually mean something, so let’s cover those before moving to the template.
Break-even analysis answers one specific question: at what level of sales does revenue equal total costs? Below that threshold, your business is operating at a loss; above it, every additional unit sold contributes to profit. This single benchmark gives you a concrete way to test your business model before you commit significant capital.
Lenders and investors care about break-even for a straightforward reason: they want to know when the business stops burning cash. A well-prepared break-even calculation signals financial awareness and shows that you understand the relationship between your cost structure and your pricing. It also acts as a reality check on your revenue projections. If your break-even point requires capturing 60% of your market in month three, that’s information the model is giving you about your cost structure or your pricing, not a number to paper over.
Break-even analysis produces two distinct outputs: break-even units and break-even revenue. Units tell you how many products or billable hours you need to sell. Revenue tells you the dollar amount of sales required. Both are useful, and a complete analysis should always include both numbers, because different stakeholders and different decisions call for different lenses.
Fixed costs are expenses that remain constant regardless of how much you produce or sell. Rent, insurance premiums, salaried payroll, loan repayments, software subscriptions, and equipment depreciation all fall into this category. They appear on your income statement whether you sell zero units this month or ten thousand. The business incurs them just by existing.
Variable costs move directly with output. Raw materials, packaging, shipping fees, sales commissions, hourly production labour, and payment processing charges all increase as you sell more. The practical test is simple: if you sold nothing this month, would the cost disappear? If yes, it belongs in the variable bucket.
Some costs fall between fixed and variable, partly fixed and partly variable. A utility bill with a flat base charge plus a usage component is a classic example. Payroll that includes both salaried staff and hourly workers is another. For break-even purposes, split the fixed portion into your total fixed cost and allocate the variable portion to your variable cost per unit. If the split isn’t stated explicitly by your vendor or supplier, use historical billing data and the high-low method, a standard accounting technique for separating mixed costs into fixed and variable components, to estimate it. Lumping semi-variable costs entirely into one bucket is one of the most common errors in any break-even analysis, and it distorts every number that follows.
Contribution margin per unit is the selling price minus the variable cost per unit. If you sell a product for $50 and it costs $18 in direct variable costs to produce, pack, and ship each unit, your contribution margin is $32. That $32 is what each unit contributes toward covering fixed costs before any profit is counted. Think of it as the amount each sale puts toward the overhead pile.
The contribution margin ratio expresses that same figure as a percentage of revenue. Divide contribution margin per unit by the selling price: $32 divided by $50 equals 0.64, or 64%. This ratio is what you use to calculate break-even revenue directly from your fixed costs, without needing a per-unit count. It’s especially practical for service businesses that bill by the hour or the project rather than by discrete units.
A low contribution margin means your fixed costs take longer to cover, pushing your break-even point higher and leaving you more exposed to volume shortfalls. Businesses with thin margins, such as low-price retail or commodity products, need high volume to survive. Service firms and SaaS companies often carry contribution margins above 60% or 80%, which is why they can reach break-even on relatively few clients or subscribers. Understanding your contribution margin isn’t just math: it’s the foundation of every pricing and capacity decision your business makes.
The break-even units formula is: =FixedCosts/ContributionMarginPerUnit. If your monthly fixed costs are $8,000 and your contribution margin per unit is $20, you need to sell 400 units before the business covers its costs for that month. Every unit beyond that 400 generates pure contribution to profit.
The break-even revenue formula is: =FixedCosts/ContributionMarginRatio. Using the same numbers with a contribution margin ratio of 0.40, break-even revenue equals $8,000 divided by 0.40, which gives you $20,000. This formula is especially useful when your business doesn’t sell a single standardised product but instead bills for variable hours, retainers, or custom projects.
Here’s a clean manual example before moving to Excel. Selling price: $25 per unit. Variable cost: $10 per unit. Contribution margin: $15. Contribution margin ratio: 60%. Monthly fixed costs: $9,000. Break-even units: $9,000 divided by $15 equals 600 units. Break-even revenue: $9,000 divided by 0.60 equals $15,000. The arithmetic is straightforward once the inputs are correctly classified. What the Excel calculator does is make those same calculations instantly adjustable so you can test different assumptions without rebuilding from scratch.
Start with a clearly labelled input section in the first rows of your worksheet. You need three core inputs: monthly fixed costs, selling price per unit, and variable cost per unit. Keep all inputs in a single dedicated column and label each cell clearly. The discipline of separating inputs from formulas matters because it means anyone reviewing your model can trace every calculated result back to a single source without hunting through formula cells for hard-coded numbers.
Add a fourth input row for target monthly profit. You’ll use this later to calculate how many units you need to sell beyond break-even. Consider using a light fill colour on the input cells to visually separate them from the results section. This is standard practice in professional financial modelling and makes the model far easier to audit.
In a separate results section below your inputs, build four formulas in sequence. The first calculates contribution margin per unit: selling price minus variable cost per unit. The second derives the contribution margin ratio: contribution margin per unit divided by selling price. The third gives you break-even units: fixed costs divided by contribution margin per unit. The fourth calculates break-even revenue: fixed costs divided by the contribution margin ratio. Because each formula feeds the next, building them in this order keeps the logic clean and auditable.
Add a fifth formula using your target profit input: units required to hit target profit equals fixed costs plus target profit, divided by contribution margin per unit. This transforms a pure coverage calculation into a sales planning tool. Now you can see not just when you stop losing money, but exactly how much volume you need to hit a specific profit goal. If you’ve named your input cells, the Excel formula for break-even units reads simply as =FixedCost/ContributionMarginPerUnit, clean and self-documenting.
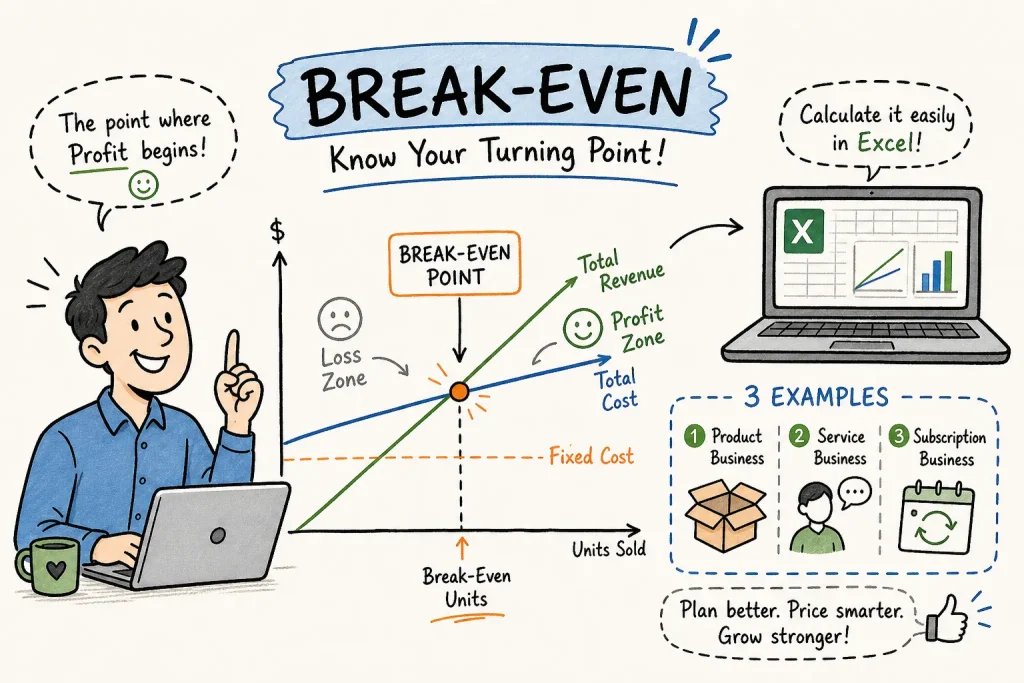
Below your results section, build a simple data table with a Units column running from zero up to roughly twice your break-even units in equal increments. Add a Total Revenue column using the formula: units multiplied by selling price per unit. Add a Total Cost column using the formula: fixed costs plus (units multiplied by variable cost per unit). Select all three columns, insert a Scatter chart with Straight Lines, and set Units as the X-axis values with Total Revenue and Total Cost as the two Y-axis series.
The point where the two lines cross is your break-even point. This chart is commonly used in lender decks and investor presentations because it makes the analysis immediately readable to someone who won’t study your formula cells. Format the chart with clear axis labels, a descriptive title, and distinct line colours. To mark the exact crossover, add it as a third data series using a single coordinate derived from your break-even units and break-even revenue formulas.
Monthly fixed costs: $6,000. Variable cost per bottle: $2 (ingredients, packaging, and shipping). Selling price per bottle: $7. Contribution margin: $5 per bottle. Break-even units: $6,000 divided by $5 equals 1,200 bottles per month. Break-even revenue: 1,200 bottles multiplied by $7 equals $8,400 per month.
This means the brand must move 1,200 units before a single dollar of profit appears on the income statement. At current retail distribution, that’s a concrete, testable number. The owner can now ask: do we have enough shelf placements and reorder frequency to hit 1,200 bottles per month? If the answer is no, the model is telling you to either expand distribution, reduce fixed costs, or raise the price before you scale production.
Monthly fixed costs: $2,700 (studio software, accounting tools, insurance, and a dedicated workspace). Variable cost per billable hour: $35 (contractor rate paid to support staff on larger projects). Client billing rate per hour: $75. Contribution margin: $40 per hour. Break-even hours: $2,700 divided by $40 equals 67.5 billable hours per month. Break-even revenue: 67.5 hours multiplied by $75 equals approximately $5,063 per month.
This tells the designer exactly how many billable hours to protect each month to avoid loss territory. In a standard four-week working month, 67.5 hours represent less than 17 hours per week at the full billing rate. That’s a manageable threshold, and knowing it shapes how the designer prices fixed-fee projects, manages capacity, and decides when it’s safe to take on a lower-rate client without risking the month’s coverage.
Monthly fixed costs: $24,000 (salaries, cloud infrastructure, and software licenses). Variable cost per subscriber per month: $3 (support costs and usage-based hosting). Monthly subscription price: $15. Contribution margin per subscriber: $12. Break-even subscribers: $24,000 divided by $12 equals 2,000 subscribers. Break-even monthly revenue: 2,000 multiplied by $15 equals $30,000.
For a SaaS business, this figure feeds directly into churn modelling. If average monthly churn is 5%, the business loses 100 subscribers every month at the 2,000-subscriber level. That means the team must acquire more than 100 new subscribers each month just to break even, before any net growth occurs. Understanding break-even alongside churn rates reveals the true subscriber acquisition burden, critical information for both product roadmap prioritisation and growth marketing spend.
Once you know your break-even point, you can reverse-engineer a target profit by adding it to the numerator. If you want $5,000 in monthly profit on top of covering fixed costs, the formula becomes: fixed costs plus target profit, divided by contribution margin per unit. For the kombucha example, that’s ($6,000 plus $5,000) divided by $5, which gives you 2,200 bottles per month, a specific, financially grounded sales target rather than a round number generated by guesswork.
Pricing decisions become far more tangible when you can see their effect on the break-even unit count. Raise your price by $2 per bottle, and your contribution margin improves from $5 to $7, dropping your break-even from 1,200 to 857 bottles. Negotiate a better raw material cost that saves $0.50 per unit, and the same compression happens. Running these scenarios directly in your Excel break-even point calculator shows how sensitive your coverage threshold is to pricing and cost decisions before you commit to either.
The most important final step is to compare your break-even point against your realistic monthly capacity, your addressable market, and your historical sales data, if you have it. If break-even requires capturing a very large share of your addressable market in month one, the model is surfacing a structural problem: your cost base is too high, your price is too low, or both. A break-even calculation that forces this conversation before you seek funding is worth far more than projections built to avoid that conversation.

The most damaging error is misclassifying costs, usually by treating variable items as fixed or leaving them out entirely. Shipping fees, card processing charges, and sales commissions are frequently omitted from the variable cost per unit, which makes the contribution margin look better than it actually is and produces a break-even point that understates the real coverage threshold. Every per-unit cost must be captured, no matter how small the individual amount.
Mixing time periods is another common failure. If your fixed costs are expressed as an annual figure but your selling price and variable cost are monthly, your break-even formula is off by a factor of 12. Always confirm that all inputs use the same time period before you run the calculation. Beyond that, using last year’s rent figures or supplier prices from a contract that’s since been renegotiated produces a break-even number that no longer reflects your actual cost structure.
The third mistake is treating the result as permanent. Break-even is a snapshot, not a fixed rule. Costs change, prices shift, and competitive dynamics affect achievable volume. Build the habit of recalculating it quarterly, or whenever a major cost input changes, and layer in scenario analysis so you understand how sensitive your threshold is to those shifts. A model that shows break-even under base, upside, and downside assumptions gives you far more useful information than a single point estimate.
A break-even point calculator is genuinely useful, but it has clear limits. It tells you the coverage threshold for your fixed costs under a single set of assumptions. It doesn’t show you cash flow timing, debt service requirements, working capital needs, or how the business performs under a multi-year growth trajectory. For an internal pricing decision or a quick sanity check, a standalone break-even tab is often sufficient. For a funding application, it isn’t.
This is where Best Financial Models (BFM) comes in. BFM builds break-even analysis directly into its Excel financial model templates as part of a fully integrated set of financial projections. Rather than a standalone calculator, break-even sits alongside the income statement, cash flow statement, and balance sheet, all driven by a shared assumption layer. Change the selling price in the assumption inputs and every connected output, including break-even, three-statement projections, and key ratios, updates automatically. That’s the structural difference between a worksheet calculation and a model built for due diligence.
Banks and investors want to see break-even in context: at what revenue level does the business cover its costs, how long does it take to reach that level on your projected trajectory, and what happens to that timeline under a downside scenario? Most commercial lenders and SBA underwriters will ask for break-even as part of a broader financial package that includes projected income statements, cash flow projections, and a balance sheet. BFM templates are designed to deliver that complete package from a single, auditable Excel workbook, with scenario analysis and sensitivity testing built in so you can present a credible range rather than a single point estimate.
Break-even analysis is one of the most practically useful calculations in business finance. Getting it right requires clean cost classification, an accurate contribution margin, and the correct formula for both units and revenue. With a well-structured template, you can often build a working BEP calculator (break-even point calculator) in well under an hour, and the result is a number that reshapes how you approach pricing, hiring, capacity planning, and funding conversations.
The real value, though, comes when break-even connects to your full financial picture. A standalone break-even point calculator is a strong starting point. A fully integrated financial model that ties break-even to three-statement projections, scenario analysis, and investor-ready outputs is what moves the conversation forward with lenders and investors.
That’s exactly what the templates at Best Financial Models are built to deliver. If you’re preparing a bank loan application or validating a new product line before committing capital, BFM templates give you a professionally structured, fully unlocked Excel model with break-even built in from the start. Browse the library at Best Financial Models and find the template that matches your business type, industry, and funding stage.
If you require a bankable business plan that includes market research and an industry-specific financial model, then contact JTB Consulting, South Africa’s Leading Business Plan Consultancy.